Balance Sheet Defined and Explained
A balance sheet is a financial accounting document provided by a publicly traded company to the public interest that summarizes a company's assets, liabilities, and capital. In particular, it details the balance of income and expenditure over a period of time to give stock market investors a quick look at the financial health of the company. If the numbers are good, it can give a good an investor a feeling of security when buying shares of stock.
This financial paperwork is very important to the average investor because it shows how well (or how poorly) a company is doing financially. It's sort of like how a bank pulls a customer's credit report to check your creditworthiness, though delves more into a snapshot of a company's inflows and outflows.
You, as an investor, don't want to invest in a company that isn't doing very well. This would be like a bank lending $50,000.00 to someone with a 600 credit score. A balance sheet gives the investor information such as if the company is holding more liabilities than they can afford and putting your money at risk.
It's just like looking at your own personal budget. It shows specifics like the worth of assets held, the amount of liabilities owed, the amount of revenue during the reporting period, the amount going to pay off liabilities. Income, expenses, and cash flow.
But a company's balance sheet is a lot more complicated and vital to the valuation of their stock price.
A Balance Sheet Can be Summarized into the Following Equation
Assets = Liabilities + Shareholders' Equity
In order for the document to be correct, each part of the equation above must balance out.
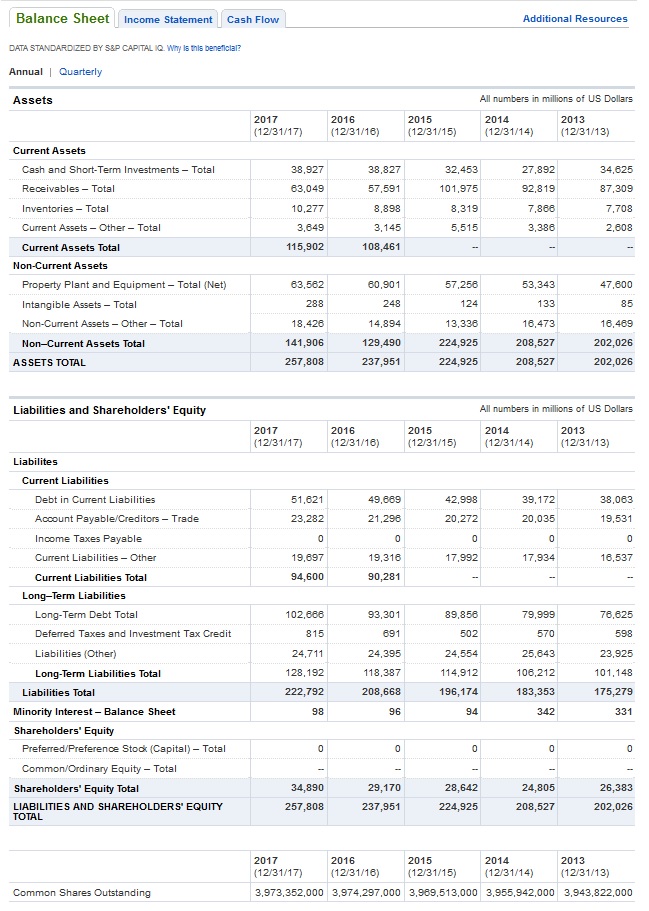
An Actual Financial Snapshot from Ford Motor Company

Overall, it is a picture, at the current time, showing where the company's finances are at that particular moment. It doesn't go into explicit detail. It shows "Inventories - Total" in the Assets, but isn't specific about what all is contained within the Inventories.
It shows no trends, but is a valuable tool when compared against other sheets from other periods or when comparing data from other companies within a particular market sector.
Now this one has five years of data on it, so it can show some kind of trend, primarily, whether the company is growing steadily or remaining pretty much the same throughout the five year time frame.
As you can see, each year's Total Liabilities balance out with the assets.
There are other financial documents included such as a Cash Flow statement and Income Statement and each can tell you a little bit more about the company.
You should always research the company before investing in them. Once all of your signals point toward buying the stock, take a look at the company profile, see what the company does for income, look back in time as far as you can and check out the history of the stock, read the news about the company, and by all means, look over the balance sheet and other financial documents to see if the stock is a strong buy.


New! Comments
Have your say about what you just read! Leave me a comment in the box below.