Stock Market Indicators Give You the Upper Hand
Stock market indicators and studies are tools within charting systems that add more information about the price of a stock besides just price. This data is derived from a set of algorithms that utilize an assortment of math formulas to show various changes in the condition of the stock you are tracking.
Stock prices change every second during trading hours. Just like a living entity, they are always moving, either up, down, or flat. Only one thing is constant with a stock - time.
Many things influence which direction a stock will go. Investor sentiment, the news media, market and financial conditions throughout the world, company performance, and emotion, to name a few, all push positive or negative momentum into a stock's price.
Stock market indicators were developed to help investors research stocks and their dynamics. Chart studies, as they are called on some platforms, or chart indicators on others, are utilized to show the history of certain variables chosen to study.
The variables being studied include price (of course), time, volume of shares being bought and sold, and other factors. These variables are changing continuously, providing oscillations and patterns over time.
Relying on one signal or indication alone is not a smart idea since it only shows one perspective of the stock. Watching three or more at a time and comparing data gives a better feel about what a stock is doing. But you must choose studies that compliment each other.
Stock Market Indicators and Their Purpose
The following stock market indicators are some of the more common studies investors use to see what their stocks are really doing. Not any one of them are the best, but combined can show a lot more information about what a stock price is doing.
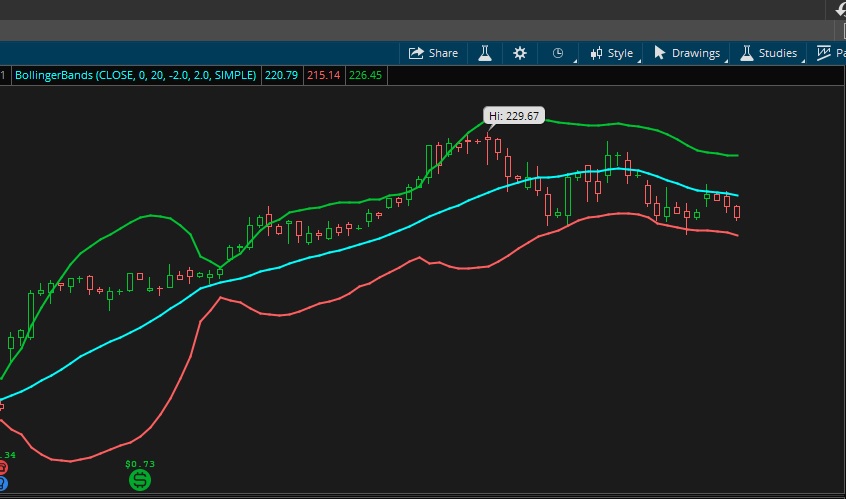
1. Bollinger Bands®
Bollinger
Bands® are displayed along with the price and provide an envelope or
channel around the stock's moving average. They represent a moving
support and resistance level, that when breached can indicate a major
event.
They can indicate a trend reversal is coming. When the stock price is going upward, the bands squeeze together. As the trend is nearing its end, it begins to widen. As the prices fall, the bands tend to widen.
This study should be used with other
studies to provide useful suggestions for a trade.
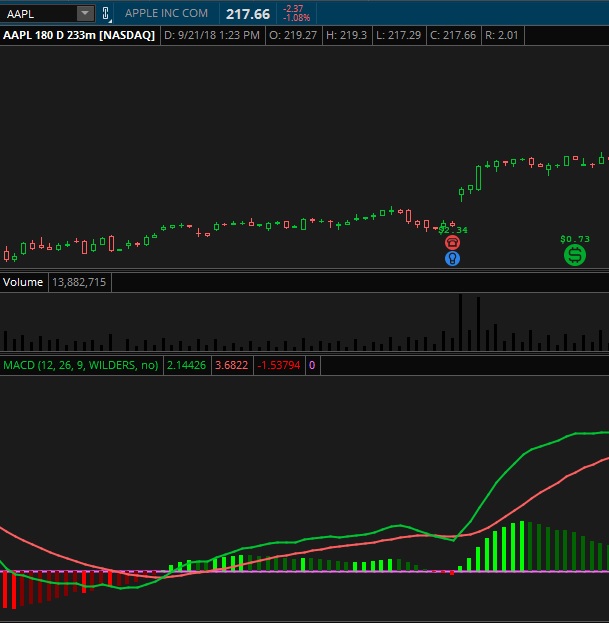
2. MACD - Moving Average Convergence Divergence
This
is one of my favorite indicators to use with my charts. There are five signals achieved with the MACD. It's a trend-following momentum
indicator utilizing three different exponential moving average (EMA)
lines.
With practice, you can also get a couple more signals of possible reversals by manually channeling the MACD, but with six solid bits of evidence, you don't gain much by it.
Read more information about the MACD Indicator and its many signals.
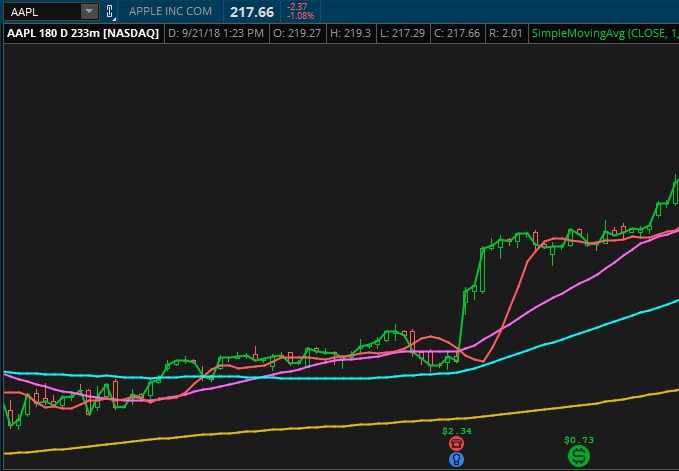
3. Simple Moving Average (SMA)
The
Simple Moving Average is the most widely used stock market indicator. It is plotted along with the stock price in the
upper area of the chart and shows the average closing prices of a stock
over a set amount of time.
The shorter the time period the faster the SMA responds to the price (showing a shorter-term trend); the longer the time period the slower the SMA responds to the price (showing a longer-term trend).
By using a short-term and a long-term SMA together, you can see the
potential beginning of an uptrend or signal a possible pullback. Common
SMAs to track are the 15, 21, 55, and 200.
You should always use
at least two SMAs on your chart as they are important stock market
indicators for trends and changes in those trends.
Learn more about the moving average.
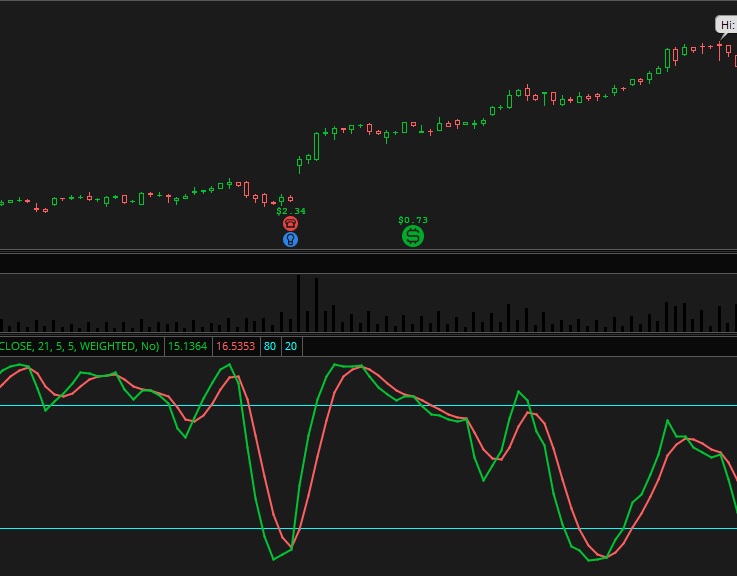
4. StochRSI
The
StochRSI applies a Stochastic Oscillator to a Relative Strength Index
rather than to a price, so it provides a good compliment to price driven
stock market indicators.
This conveys overbought and oversold conditions of the stock and can show when a reversal is about to occur. This indicator should always be used with other ones when making trade decisions.
Learn more about Stoch RSI and see how many signals it has to help with your trading decision.
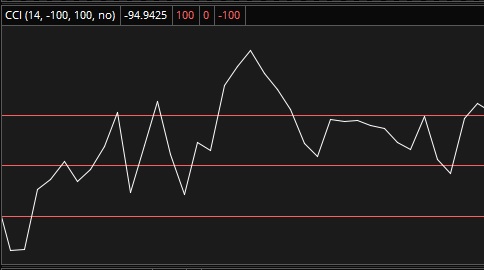
5. Commodity Channel Index - CCI
This
technical indicator is another stochastic oscillator that is based on
momentum. It is a great indicator of when a stock is reaching an
overbought or oversold condition.
It can also be a good indicator of highs and lows in stock prices and can show signs of a shifting long term trend.
Learn more about the Commodity Channel Index to see how you can incorporate it into your stock trading system.
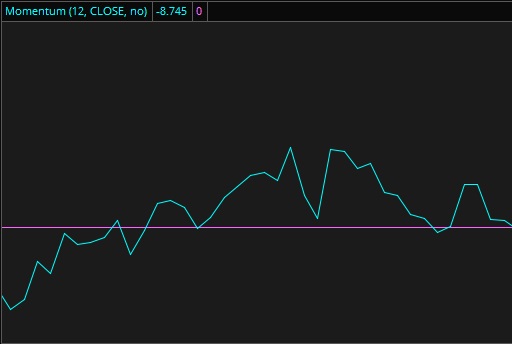
6. Momentum Indicator
A
momentum indicator is a great way to gauge a continuance of a market
trend. If a price is starting to drop a little but momentum is still
going strong, a stock trend shift may not be occurring just yet.
This indicator is a good supporting evidence tool to indicate that a stock's price has
strength to continue pushing. It should be used with other analysis
tools to make trade decisions.
7. Volume
Volume
is a representation of shares traded during a
period of time. The number of shares is relative since if something is bought, it is also sold.
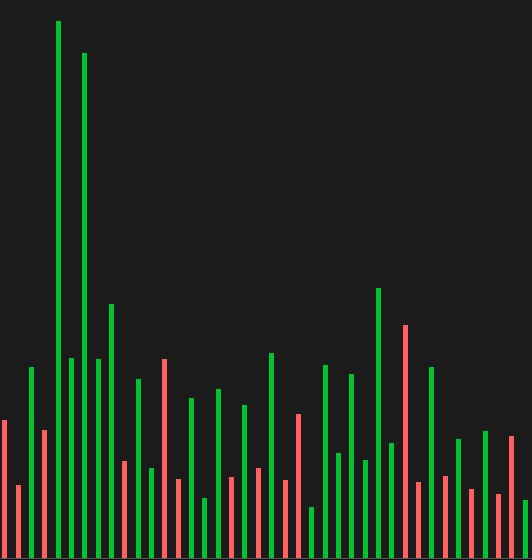
The green bars indicate that the stock closed higher than it did the previous day. The red bars say the stock price closed down from where it closed the previous day. This roughly tells you if the price was overall rising or falling based on the previous trading day's volume.
Every trade made in a stock adds to its volume. It is a good measure of the strength of a market move. High volume represents a stronger move. You can use volume to confirm a reversal in either direction.
8. Directional Movement Index
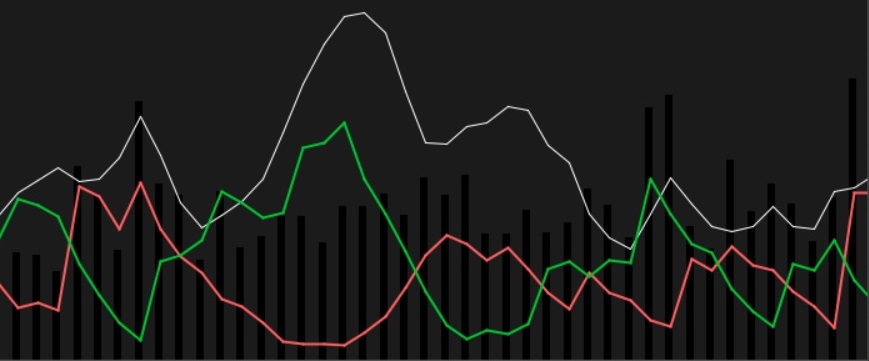
The DMI Indicator or Directional Movement Index is a trend-following chart study that plots three lines, two of which provide a buy or sell signal and the other confirms the indication based on strength.
The DMI Indicator is a great tool when used with other charting indicators and can help make trading decisions with certainty.
9. Candlestick Signals
Candlestick signals are a great way to catch a trend shift or reversal. There are 42 different candlestick patterns that tell you when a trend is about to change from down to up or up to down. Some even give you buy and sell signals.
Committing just a couple of these to memory will speed up your analysis of a stock so you can immediately recognize the end of a long trend run. Check out some more detailed information about candlestick signals.
There are literally hundreds of different stock market indicators to help you make a stock trading decision. You can find them with any charting system. You just have to choose the right ones for you.
Remember, you don't want to overwhelm yourself with too many signals. You want to choose three to five strong signals and use them for your decision making. If you need more proof, you can check other studies to give you more evidence to reinforce your trade.
Learn a stock trading strategy that combines the right blend of indicators to help you reach the most profitable trades.

New! Comments
Have your say about what you just read! Leave me a comment in the box below.