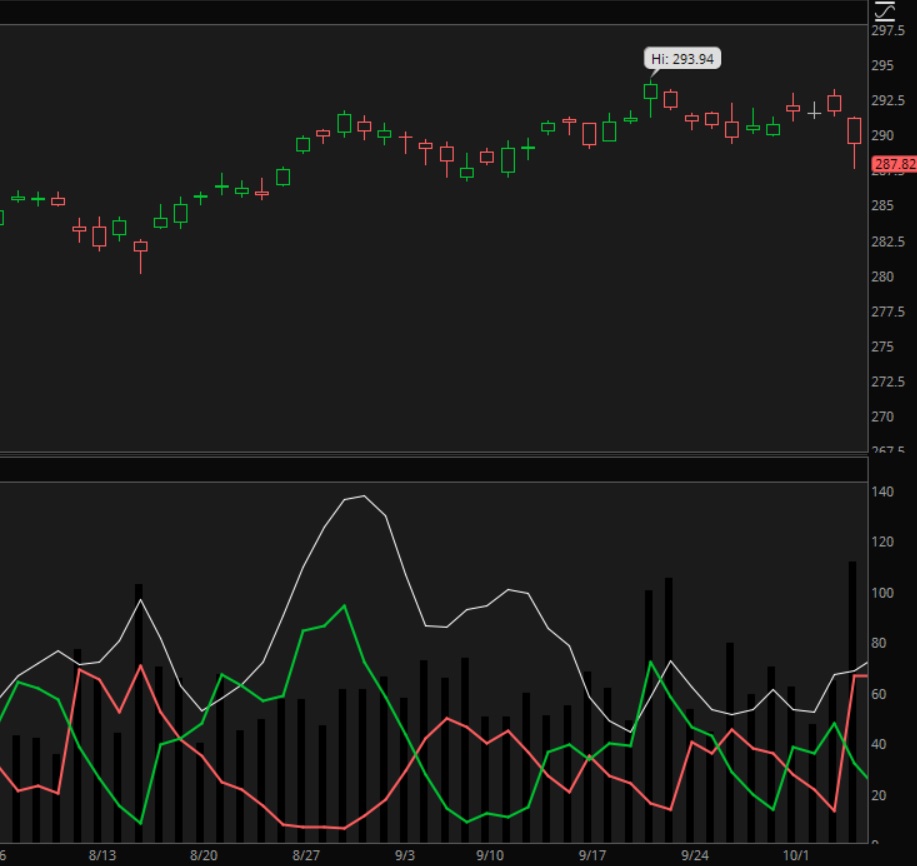
DMI Indicator and its Trading Signals
The DMI Indicator, or Directional Movement Index, is a mathematically driven trend-following chart study that can be used for several trading signals and accurate trend influences. This indicator was developed by the same man who created the Relative Strength Index, J. Welles Wilder.
There are three lines involved with the DMI: The Directional Index + (DI+), the Directional Index - (DI-) and the Average Directional Index (ADX). The DI+ and DI- give the signals while the ADX is used for confirmation.
It's a pretty simple tool to set up as it only has a few parameters, unlike the MACD and Stoch RSI which have quite a few variables.
How to Set up the DMI Indicator
The parameters for the Directional Movement Index are pretty straight forward and works great with other indicators. There are only two parameters to worry about and they are as follows:
The Length: This is used to calculate the three line plots. This number is how many bars to use (one bar per day on a daily chart).
The Average Type: This is one of the five moving average types to use with the plot (simple, exponential, weighted, Wilder's, or Hull). I prefer to use Weighted because it tends to smooth out the lines a little better.
The two parameter inputs are used to calculate the three line plots, the DI+, DI-, and ADX.
The Plus Directional Indicator, or the DI+, is figured as an average increase of high price and is divided by the Average True Range, then multiplied by 100.
The Minus Direction Indicator, or the DI-, is the opposite of DI+ and figures the average of low price instead.
The Average Directional Indicator, or ADX, is figured as an average of the directional index.
The Signals and Trends of the DMI Indicator
For plotting purposes, and to see the signals better, I use a green line for DI+, a red line for DI- and a light blue or white line for the ADX line. The following signals are delivered by the indicator:
1. Crossing Signals for Buying and Selling. When DI+ crosses DI- upward, it is a buy signal. When DI+ crosses DI- downward, it is a sell signal.
2. Trend Direction. When the green DI+ line is above the DI- line, the trend is usually upward. When the red DI- line is above the DI+ line, the trend is usually downward.
3. ADX Confirmation. The signals of the DMI Indicator are usually better if the ADX line is rising and its value is over 50, thus a stronger signal.
The three plots in the indicator are all used together and can accurately show a good trend direction of a stock. I don't recommend using this indicator by itself, but it provides very strong evidence when used with other indicators when making a trade decision.


New! Comments
Have your say about what you just read! Leave me a comment in the box below.