What is Moving Average and How is it Utilized by Investors?
What is moving average? It is basically the average price of a stock based on a period of time. The amount of time between price snapshots will determine a different price average to show an investor a different trend. Each day as a stock price moves up and down, there can be a lot of volatility that clouds the real trend of what the stock is actually doing. Averages can be tracked on charting software and provide you with this key information.
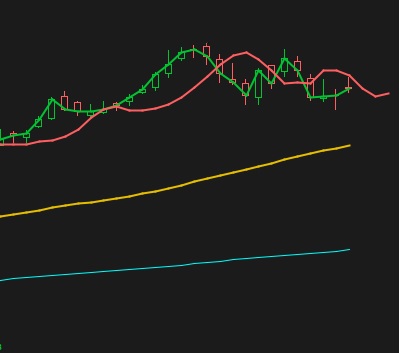
In the above image, there is a Simple Moving Average (SMA) of 50 entered into the SMA tool. This "50" represents how many trading days of price is considered in the average (in this case, 50 days worth of data).
From this SMA (indicated by the yellow line), you can see the stock is currently trending up. Compared to the actual price track, it shows a more long term consensus of what the stock is doing.
Not only does it show an average trend for the stock, it also shows the potential for a change in that trend. The longer the time frame used for the moving average, the slower the trend line changes.
Watch the video below to learn about how the Simple Moving Average can assist you in determining price swings, trends, support, and resistance.
How a Moving Average Can Indicate a Buy or Sell
The great thing with charting tools is that you can add in as many tools as you want to give you even more information. On a chart, you should always run an SMA 50 and an SMA 200 indicator at the same time.
The two average price lines follow different tracks over the course of time. These two averages are important because they are far enough apart to "cross" at key points of time.
This is where things get interesting.
Where the SMA 50 (short term trend) crosses the SMA 200 (long term trend) up in the above image, it indicates a shift in the trend upwards. This is known as the "golden cross" or bullish signal that the price of the stock is most likely going to rise.
If the SMA 50 crosses the SMA 200 down, this is a good indication of the trend shifting downward. This is known as the "death cross" or a bearish signal that the price will start trending down.
Most of the time, by the time the SMA's cross, the move has already occurred. But if you haven't bought or sold by those times, it may be time to get in and out.
Never Trade on Information from One Signal
Though it is very tempting, never make a trading decision based on two SMAs crossing alone. A single SMA cross is considered "supporting evidence" for a trade. Remember, moving average signals only show a shift in trend for a stock, not a buy point. It could take weeks for the stock to actually start moving in the direction of the trend signal.
There is a special trade signal called a "Rainbow" cross that is discussed in my trading signals secrets that uses several SMA lines. When they all cross, it is strong supporting evidence toward making a trade in the direction of the cross (up or down).


New! Comments
Have your say about what you just read! Leave me a comment in the box below.