How a Momentum Indicator Helps Stock Market Investors
The Momentum Indicator is a great tool for investor information. It provides a solid indication of strength, direction, and can also signal a buy or sell based on certain circumstances.
As a stock trader, momentum shows the strength or weakness of a stock in both directions. It can tell if a stock is going to have a normal rebound, a strong jump, a weak retreat, or a powerful drop.
Having a momentum indicator in your charts helps back up trade decisions and is essential if you want to make a lot of money in the stock market.
What is Momentum?
What is momentum? Unlike most indicators and charting tools that are based on price levels, momentum is the measure of the velocity of price changes. Based on the period of time, it is the closing price minus that many days ago.
For instance, for a twelve day (12 day) momentum indicator, you would subtract the closing price from twelve days ago from the last closing price of the day. This velocity changes every day, giving an indicator of speed in price changes.
When the price change is slowing way down, it may be getting ready to shift in the opposite direction. Stock market investors use momentum to determine the strength of an up trend or down trend.
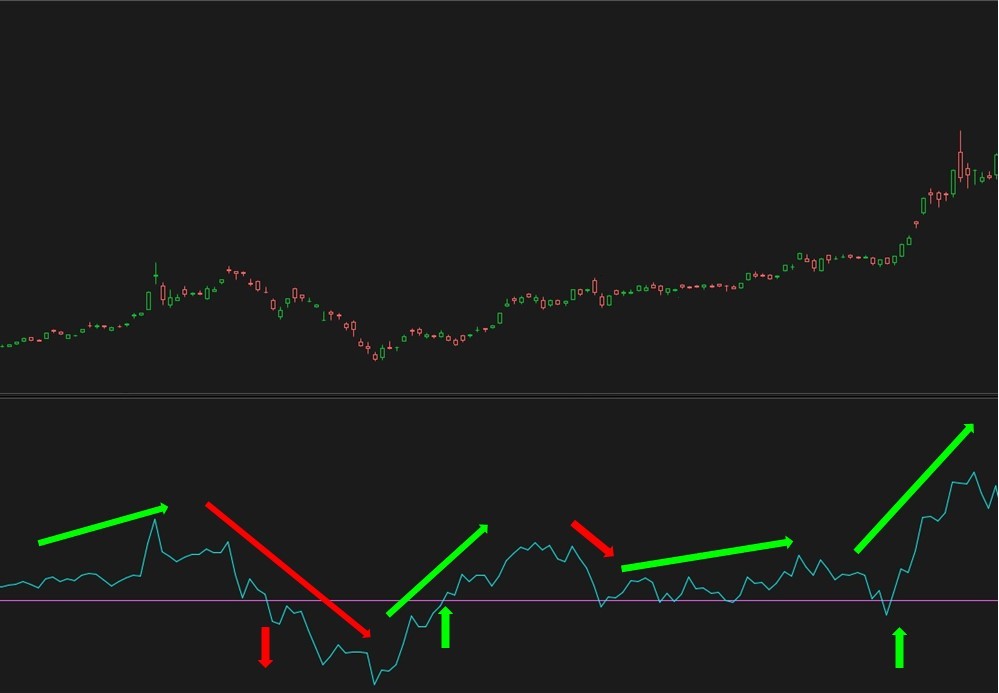
A stock's momentum can move up, sideways, or down. By itself, depending on the degree of angle, it can tell how strong the trend is in that direction. Mixed with other variables, it can also show great buy/sell signals to assist in making an informed trading decision.
The Basic Momentum Indicator
The basic momentum indicator is simply a momentum oscillator based on a desired time frame. The default time for the oscillator is 12 days, but you can tweak that number around to best suit your trading techniques.
This technical indicator primarily shows the trend of the stock and the strength of that trend. Based on the direction, the momentum shows if a stock price is moving up or down. The steeper the movement of the momentum line, the faster the price moves in that direction.
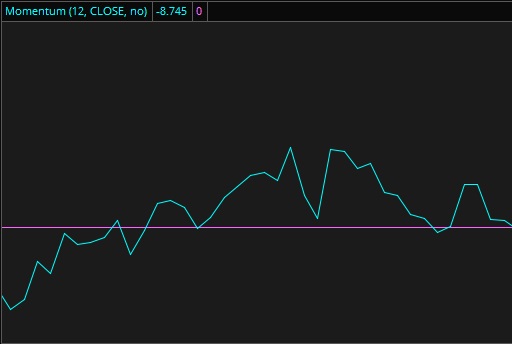
Normal trading is generally seen as a slowly oscillating line, while volatile trading is more erratic with higher highs and lower lows.

Using this indicator with Extreme Stock System, I can gauge the strength in a stock's jump based on if the momentum is dipping below an average of lows. The lower it goes below the average, the more powerful it will spring back up.
The Momentum SMA Oscillator
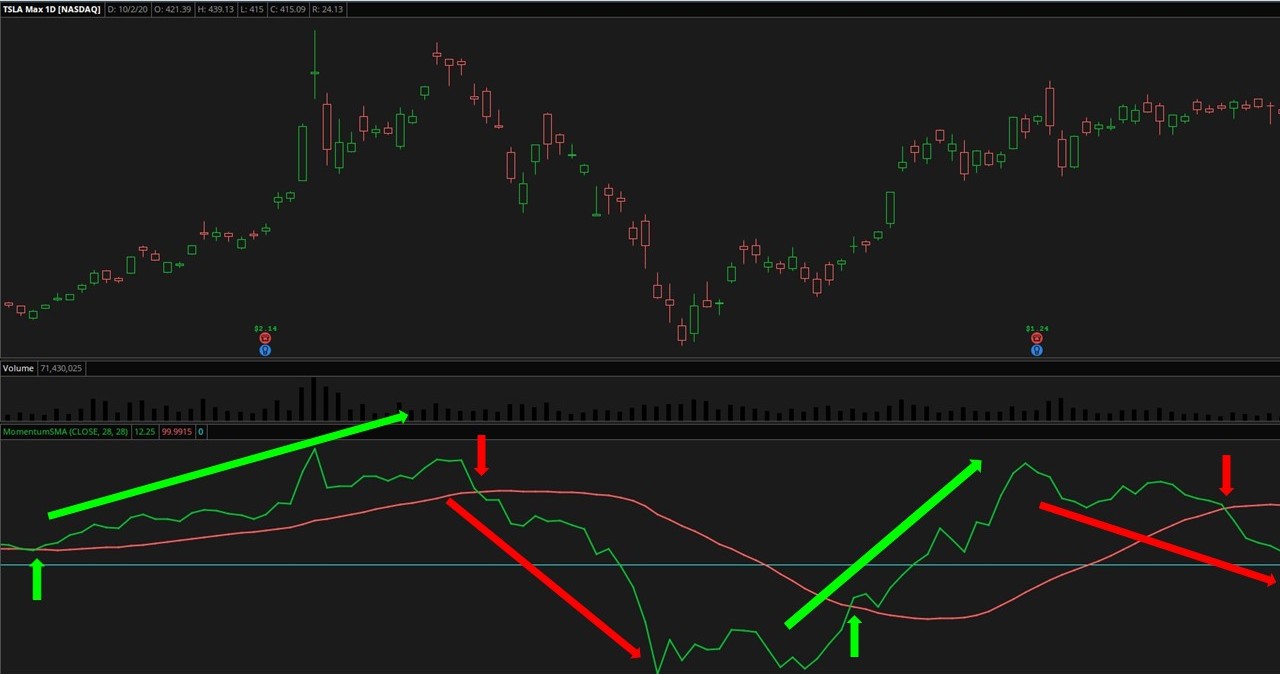
The Momentum SMA Oscillator may not be available on all trading platforms, but gives some better signals for trend reversals. These aren't exactly buy or sell signals by themselves, but can be used in conjunction with other signals to lock in a trade.
This momentum indicator uses a standard momentum line (for the velocity of price) and an SMA line (for price level) to show crossing signals between the momentum and SMA.

When the momentum line (green) is above the SMA line (red), the stock is
trending up. When the momentum line (green) crosses down through the
SMA line (red), it indicates a shift in trend downward (or a sell). When
the SMA line (red) is above the momentum line (green), the price is
trending down. When the momentum line (green) crosses up through the SMA
line (red), it indicates a shift in trend upward (or a buy).
Again, used in conjunction with other indicators, it can be a great signal for buying and selling stocks.
Advanced Momentum Charting
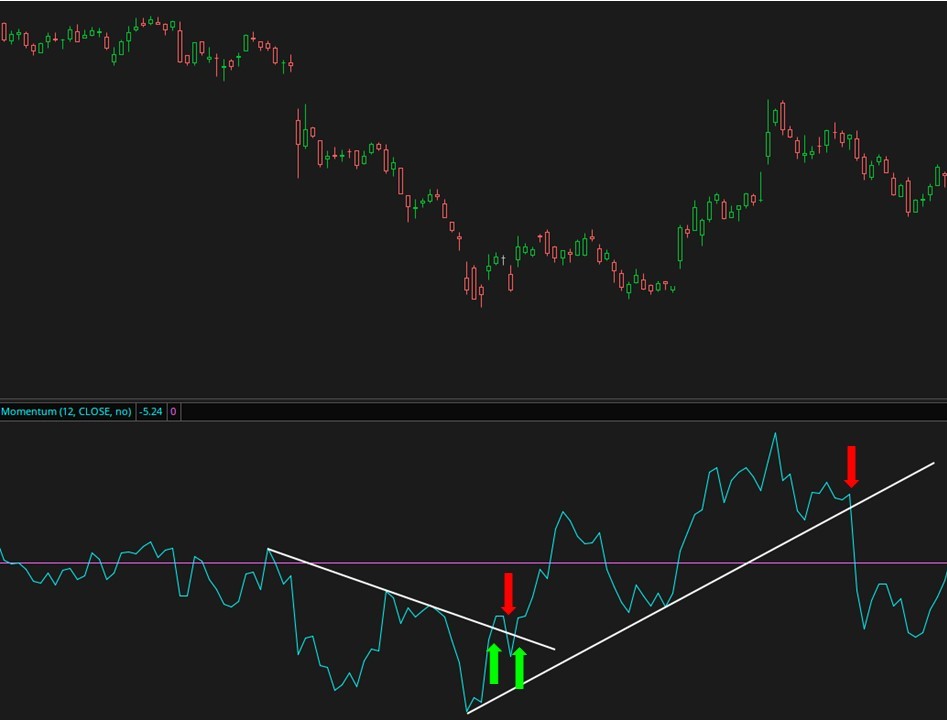
There are other ways to show signals on a momentum indicator such as divergence lines and breakouts. This is more advanced, but can help show when a stock is shifting trends from one direction to another.

For a down trending stock, draw a line down along the top peaks of
momentum from highest, to next highest. When the momentum breaks through
that line in the opposite direction, a trend shift up may have
occurred.
For an up trending stock, draw a line up along the
bottom peaks of momentum from lowest to the next lowest. When momentum
breaks through that line in the opposite direction, a trend shift down
may have occurred.
The momentum indicator is a powerful gauge to show the velocity of a stock and can show trends. As you can see with the many options above, you can use momentum to signal trend reversals and see the strength of a trend either up or down.
This is one of the must have indicators you should always be using on your charts to assist in making an informed trading decision.


New! Comments
Have your say about what you just read! Leave me a comment in the box below.