MACD Indicator for Signaling Stock Price and Trend Changes
The MACD indicator is a great tool for stock charting and is one of the most sophisticated, all telling tool for a stock trader. It is a wonderful tool to detect trend changes and when to buy and sell stocks. This is one of my favorite indicators, and you will soon see why.
The Moving Average Convergence/Divergence plot, the MACD as it's called, is one of my favorite studies for my charts. If I were only able to use one indicator, this would definitely be the one. But, since all of the information is gathered from the same source, it should never be used independently for the decision making process.
What is the MACD Indicator?
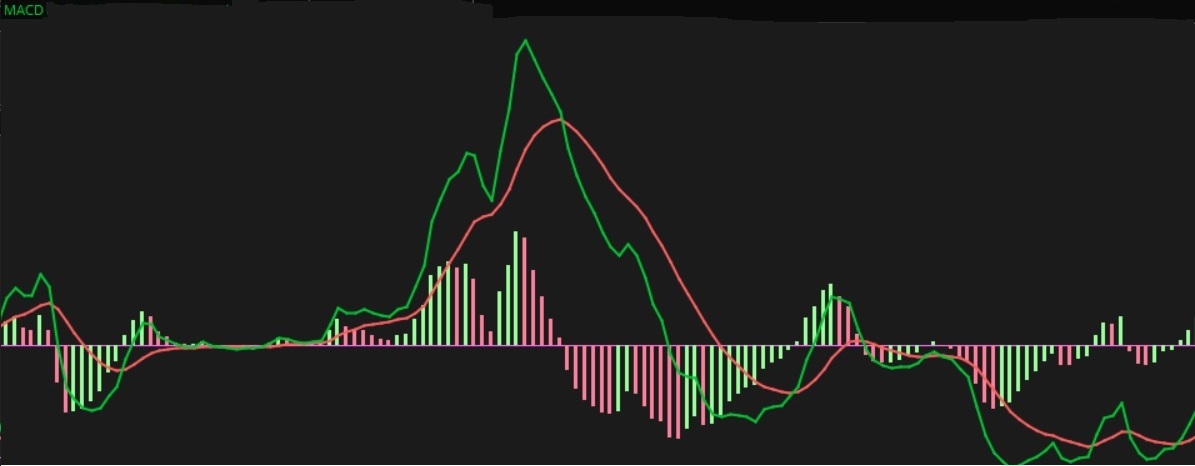
The MACD is an oscillating chart study used for assessing various trend features of a stock. It is calculated by taking two specific but different price averages (a fast moving average and a slow moving average) to figure out the difference.
It also shows a signal line which is actually the average of the first two price averages' difference.
The study itself is rather neat because it shows so much information. You are looking for crossovers and shifts in histogram bars (based on the difference between the MACD and its moving average) to provide valuable signals in trend shift and possible a heads up before the shift.
A lot of options and stock market traders use the signals from the MACD Indicator as their deciding factor when to buy, but use other studies and indicators to support their decision.
How to Set Up the MACD
There are several parameters involved with the MACD that you must get right in order for the indicator to work correctly. I've tweaked and studied outcomes for months to figure out which numbers were the best to use with the indicator.
Most charting programs have this indicator in its tools or studies. But depending on which charting system, you can adjust the parameters to your own numbers.
The parameters that can be adjusted are as follows:
1. The Fast Length. This number is a fast moving average (based on price) representing the number of bars are used to calculate the average. This number is smaller than the slow length.
NOTE: If you are using a daily chart, bars will indicate each day.
2.
The Slow Length. This number is a slow moving average (based on price)
representing the number of bars used for the calculation. This number is
larger than the fast length.
The Fast and Slow Lengths of the MACD Indicator provide the first line (I use green for this line).
3.
The MACD Length. This number is the desired number of bars that will be
used to produce the moving average for the MACD signal line.
The MACD Length line is the second line of the oscillating plot (I use red for this line).
4.
The Average Type. Moving averages can vary based on what type they are.
You can choose simple (what you see for price is what you get),
exponential (reacts more significantly to recent price changes),
weighted (more weight is given to newer prices), Wilder's (like
exponential except it responds more slowly to price changes), or Hull
(which is extremely fast and smooth).
What Are The Buy and Sell Signals of the MACD?
All in all, there are 5 different kinds of signals on the MACD Indicator that tell you when to buy or sell a stock or tell something about the price trend. They are as follows:
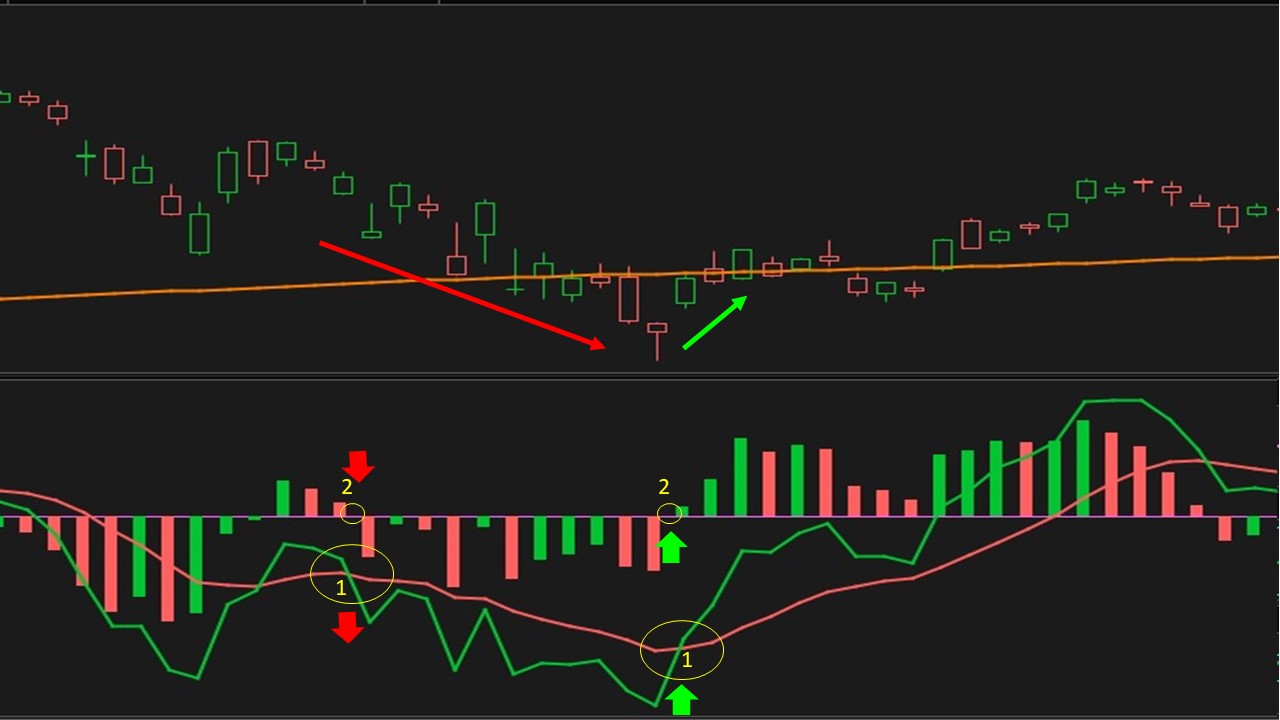
1. Crossing Value and MACD Length Lines. These produce buy and sell signals based on the direction the Value line crosses the MACD Signal Line. If, for instance, it crosses up, it indicates a buy.
2. Histogram Bars crossing the Zero Line. When the Histogram Bars cross the zero line, it indicates a buy or a sell based on the direction of the cross.
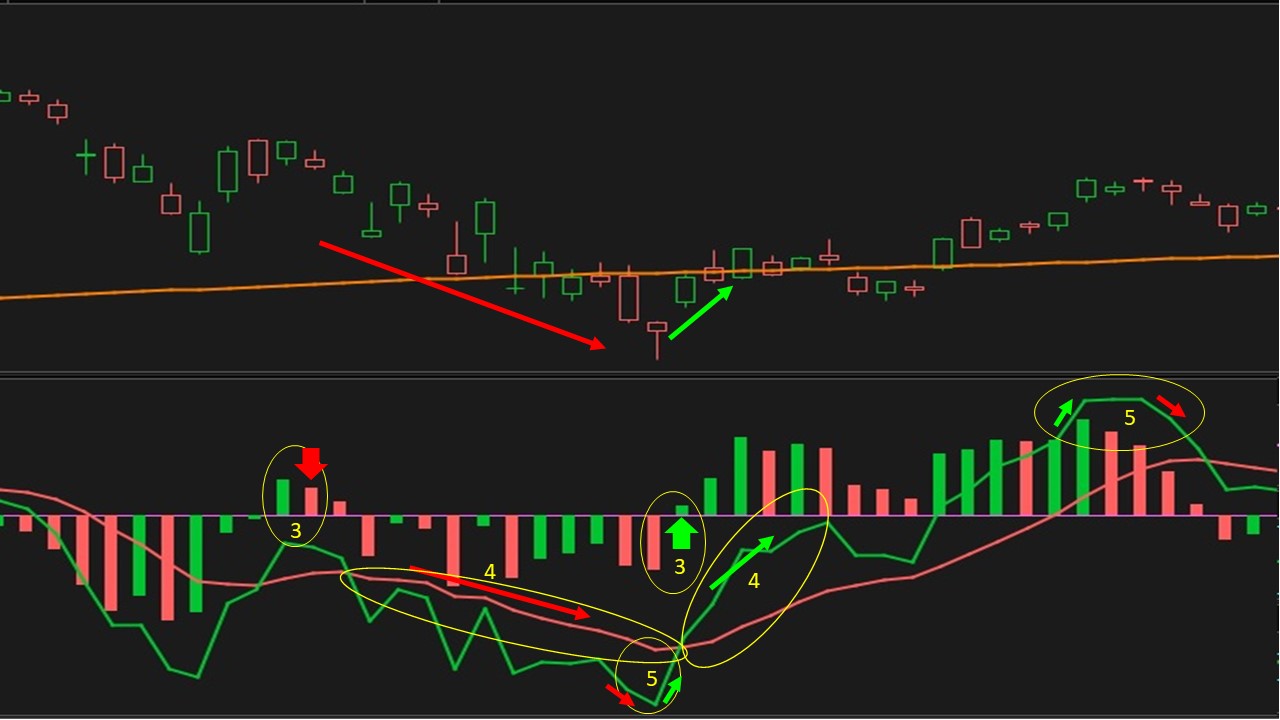
3. Histogram Reversal.
This is when a negative or positive leading bar shifts direction (from
green to red or red to green). If it shifts from negative to positive,
it is a buy signal. If it shifts from positive to negative, it is a sell
signal.
4. Current Price Trend.
A trend is indicated by the prevailing line and the direction of that
line. If the prevailing line is the value line and it is going up, the
stock price is trending up. If the prevailing line is the MACD and it is
going down, the stock price is trending down.
5. Trend Shift.
When the value line changes direction from up to down, the trend is
shifting down. When the value line is shifting from down to up, the
trend is shifting up.
Any combination of these signals can be used as a decision point to buy or sell stocks. Below is a video training segment for the MACD Indicator. This shows all of the signals of this indicator and explains the dynamics of the MACD.
It is not recommended using the MACD Indicator as the only decision making tool when choosing to buy or sell a stock. Always refer to other indicators for additional signals to help with the decision process to back up your trades.

New! Comments
Have your say about what you just read! Leave me a comment in the box below.