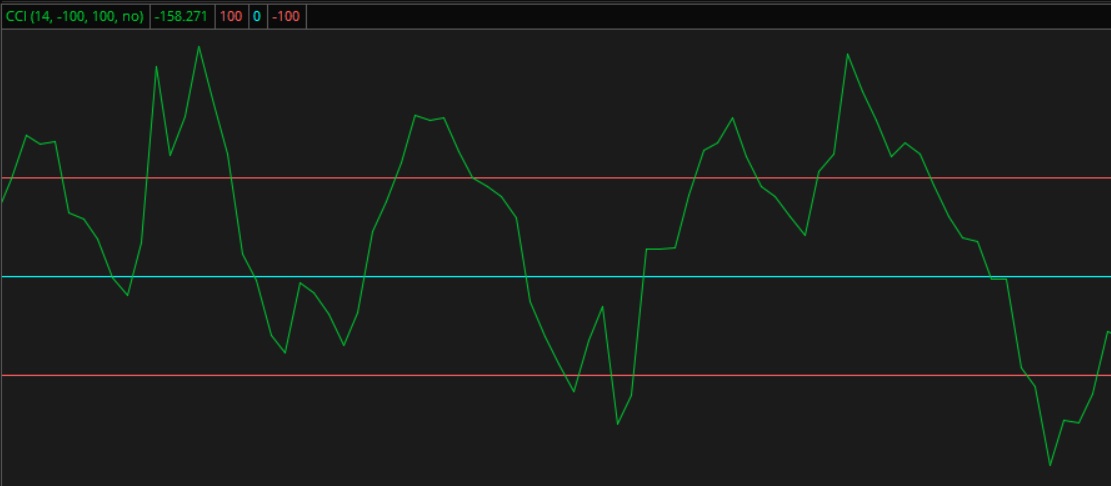
The Commodity Channel Index and its Signals
The Commodity Channel Index, or CCI, is a simple oscillator, but bases its calculations and variations on statistics, not just price of the security. It can produce very strong influence signals and trends while providing good backup to your trading decision.
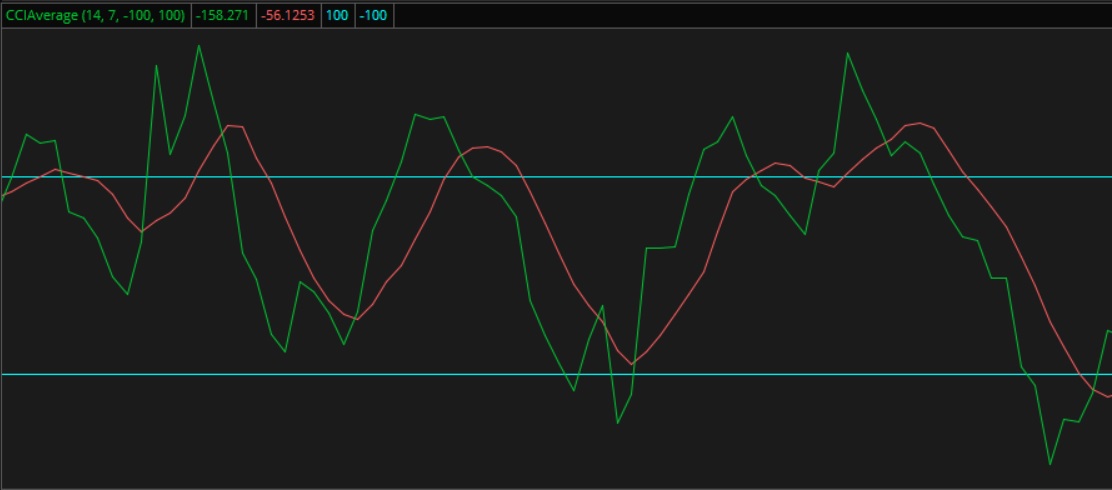
The indicator works great by itself, but adding an average line to it can provide a better picture on the chart that leaves all doubt on the sideline. In the thinkorswim trading platform, it is called the CCIAverage.
Setting Up the Commodity Channel Index
The CCI Indicator contains very few variables to make it work. The embedded algorithm does all of the work internally so all you have to do is concentrate on the signals it provides.
The following parameters are used to set up the CCI Indicator:
The CCI Length: This number is how many bars are going to be used in its calculation. The calculation is done by adding up the values in the data set and then divide by the number of values that you added.
For short-term traders, a shorter length may produce better signals. For long-term traders, a longer length may be a better fit. I use the color green for this line.
The Over Sold Line: This is normally set to 100. When CCI moves above the line, the stock is in an over sold condition.
The Over Bought Line: This is normally set to -100. When CCI moves below the line, the stock is in an over bought condition.
If using the CCI Average indicator, there is one additional parameter to enter:
CCI Average Length: This is the number of bars used to calculate the average of the CCI. I use the color red for this line.
The Signals of the CCI Indicator
This cleaver tool uses its unique mathematical method to create several indications to stock investors. The following signals are provided by the CCI:
1. Trending Signals. When the Commodity Channel Index fluctuates around the zero line, there are no signs of trending. But when the trend up or down is strong, it accelerates the CCI and provides a common trend with the price.
2. Trend Shifts. When the CCI line goes up above the 100 line (overbought) or down below the -100 line (oversold), this is a "cocking" action. As the price shifts back below or above the respective lines, this "fires" and shows a trend shift in the opposite direction.
If the CCI Average is applied, the following additional signals are available:
3. Crossing Signal. When the CCI line aggressively crosses the CCI Average Up, this indicates a Buy. When the CCI line aggressively crosses the CCI Average Down, this indicates a Sell.
4. Trend Signals. When the CCI Length is above the CCI Average, it also indicates an uptrend. In the opposite, if length is below the average Commodity Channel Index, this indicates a downtrend.
Like all other indicators, the Commodity Channel Index should not be used by itself to indicate a trade. It can be used as great backup for a trend pattern or supporting evidence for a trading decision.


New! Comments
Have your say about what you just read! Leave me a comment in the box below.