Use Crypto Charts to Safely Trade Crypto Currencies
You can use crypto charts to receive signals to buy and sell just like you do for stocks in the stock market. The only thing is, you have to find a good charting system that allows charting crypto currency.
When I just started trading crypto, I didn't know how to analyze it. I was lucky and got in at the right time and gained about 50% more than my total investment in about ten days. But I didn't catch the time to sell and lost all of those gains in a few weeks, getting in at the wrong times and selling at the wrong times.
A friend suggested a great platform to use for my crypto charts and it seems to be working great. I highly recommend anyone interested in trading crypto to use charts to determine your best entry and exit points.
Best Platform for Crypto Charts
The platform recommended to me has two options, but the free option works just fine and keeps my investments safe. It is called Tradingview and allows charting of all crypto currencies in trade.
When looking at the crypto charts, you will notice they look just like regular company stocks. They oscillate or move up and down the same way (with supply and demand) and they create the same types of patterns and signals for buying and selling.
Head over to Tradingview to check it out. Setting up the chart is pretty easy and puts the power of staying safe with crypto currency immediately into use.
Setting up a Crypto Chart
Setting up crypto charts is very easy once you are in the platform. Simply click on charts to begin. In the top right, click on the input area where you put a stock ticker. When the symbol search window opens, change it to cryptocurrency and it will allow you to enter crypto symbols.
I had to figure what the symbols were for each of the common types, but a list of them is below to help. I use USD for the comparison type, but you can use any currency you want to compare it to such as Euros or other bitcoin currency.
Types of Crypto and Their Symbols
Bitcoin is BTCUSD
Ethereum is ETHUSD
Ethereum Classic is ETCUSD
EOS is EOSUSD
Dash is DASHUSD
Algorand is ALGOUSD
Stellar Lumens is XLMUSD
Cosmos is ATOMUSD
Uni Wallet is UNIUSD
Tezos is XTZUSD
Chainlink is LINKUSD
Note: These symbols do not work in traditional stock market charts like thinkorswim yet.
If you want to trade others, consult you crypto trader platform and see
what the symbol is. Just add USD to the end of it (or the currency you
are comparing it to) and it should come up with the symbol for you.
There are differences in the charts, so choose the symbol that best
suits your needs. If you use Coinbase as your trading platform, you
should choose the symbol that corresponds with Coinbase.
Enter in
the symbol you want to set your crypto charts up for. You should only
see the price chart on your screen. At the top in the menu bar, click on
Indicators, Built-ins, scroll down, and click on the following three
indicators: MA Cross, MACD, and Stochastic RSI.
To set up your indicators, hover over the name of the indicator you want to change on the chart and click the gear icon.
Set up Stochastic RSI as Follows:
In the Inputs section, set Resolution to Same as Symbol, K to 3, D to 3, RSI Length to 14, Stochastic Length to 14, and RSI Source to close. Click on style and set your colors to the ones you like (I set mine to K green and D red, upper band to 80 and blue, and lower band 20 and blue). Make sure you change the bands to 20 and 80 to see the more extreme overbought and oversold conditions.
Set up the MA Cross as Follows:
The input should be Same as Symbol. In the style section, choose your colors to easily see the MA cross.
Set up the MACD as Follows:
In inputs, set resolution to same as symbol, Fast Length to 3, Slow Length to 7, Source to close, and Signal Smoothing to 7. Set your colors to the following: Histogram Color 0 to green, color 1 to red, color 2 to green, and color 3 to red, MACD color to green, and signal to red. Precision should be default.
That's it, you are all set up and ready to read your crypto charts.
Reading Signals on Your Crypto Charts
Now for the fun part. Learning how to spot signals on your crypto trading chart. There are a total of four hard buy/sell signals and five trend direction indicators.
Hard Buy Sell Indicators for Crypto Charts:
1. MA 9 Crosses MA 21 UP is a soft Buy
2. MA 9 Crosses MA 21 DOWN is a soft Sell
3. Stoch RSI K (green) crosses D (red) Up is a hard Buy
4. Stoch RSI K (green) crosses D (red) Down is a hard Sell
5. MACD (green) line crosses Signal (red) line Up is a hard Buy
6. MACD (green) line crosses Signal (red) line Down is a hard Sell
7. MACD Histogram Ribbon moves up through the 0 line indicates a hard Buy.
8. MACD Histogram Ribbon moves down through the 0 line indicates a hard Sell.
Soft Buy Sell Indicators and Trend Direction Indicators:
1. MACD Histogram Reversal from Green to Red is showing a possible downward direction shift or a soft sell with other hard evidence indications.
2. MACD Histogram Reversal from Red to Green is showing a possible upward direction shift or a soft buy with other hard evidence indications.
3. If MACD (green) line is above Signal (red) line, it indicates an upward trend.
4. If MACD (green) line is below Signal (red) line, it indicates a downward trend.
5. If Stoch RSI K (green) line is going up above the D (red) line, it indicates an upward trend.
6. If Stoch RSI K (green) line is going down below the D (red) line, it indicates a downward trend.
7. If the MA 9 (more erratic) line is going upward, it is indicating a short-term uptrend.
8. If the MA 9 (more erratic) line is going downward, it is indicating a short-term downward trend.
9. If the MA 21 (smoother) line is going upward, it is indicating a short-term uptrend.
10. If the MA 21 (smoother) line is going downward, it is indicating a short-term downward trend.
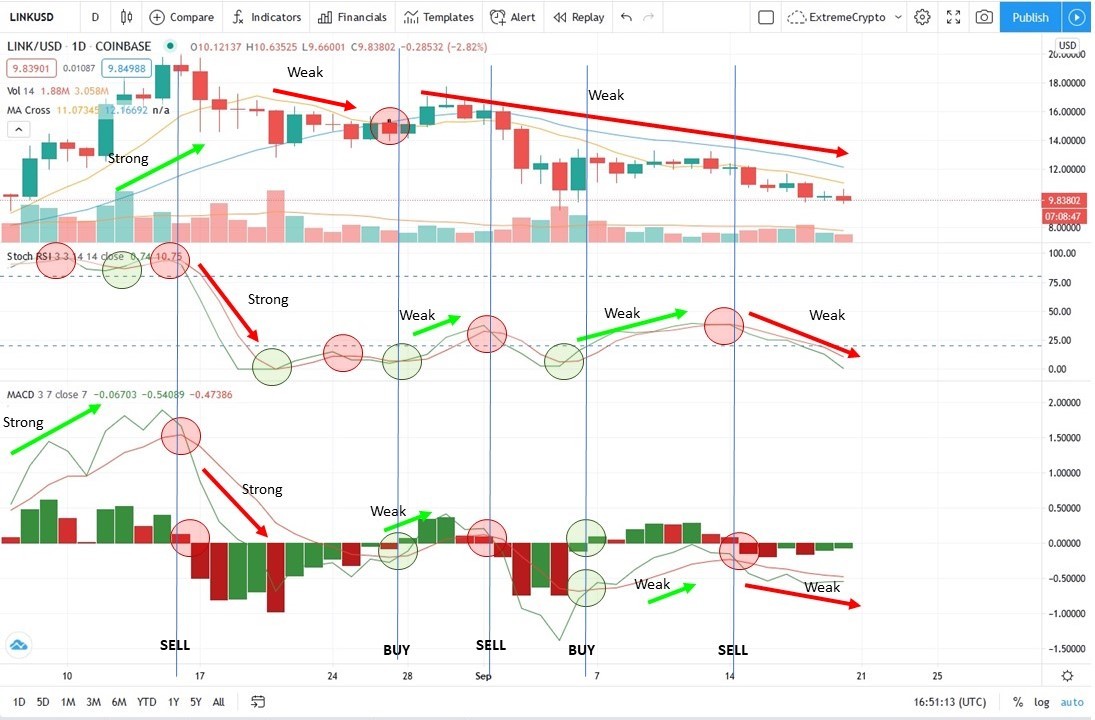
The image above shows examples of buy and sell indicators in action utilizing LINKUSD (Chainlink). In this example, the price is peaked about the 16th of August and 3 sell indicators signaled down. (Good time to sell). At this point you should stay out of this crypto currency because of the MA shift down on the 27th of August (even though two signals said to buy that day). On the 1st of September, two more signals said sell (Still a good time not to buy this crypto). Another good indication that it's safe to buy or not is the price above the MA 21 (safe) or below the MA 21 (not safe).
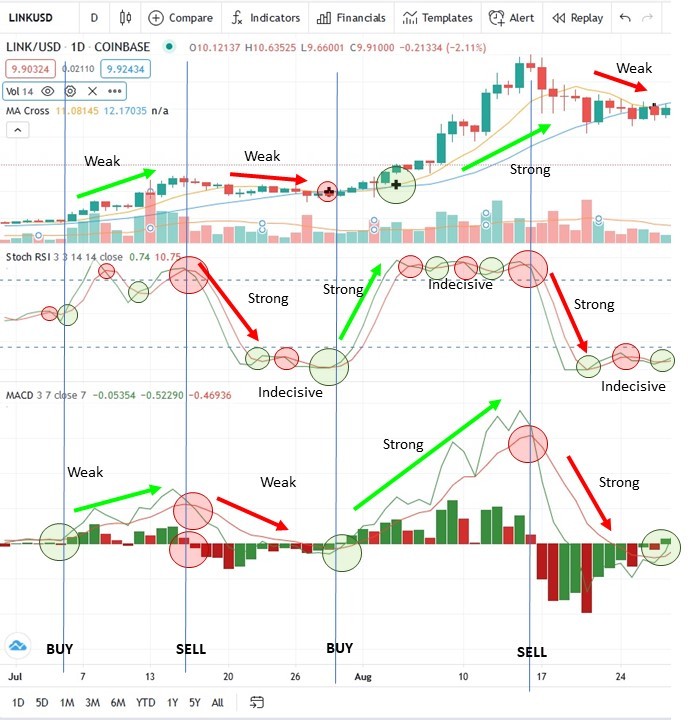
The image above shows more examples of buy and sell indicators.
The stronger the indication, the more solid the signal is. Stronger trends are generally followed by a stronger trend in the opposite direction. Weaker trends are followed by weaker trends. Indecisive areas where it's moving up and down every couple of days are the times you should hold your position until you get better signals to buy or sell.
If you don't have enough information on the crypto charts to make the indicators work, it's not recommended to trade that currency. This happens when there is a newly available crypto currency. It is very risky to do and can be very profitable, but you can't get good signals to get out of the trade in time. Play it safe and only trade currency you can receive signals for.
With these hard and soft evidence signals and trend directions, you can better determine when to buy and sell crypto currency at the best times.
Also be sure to read the news about the various crypto currencies you intend on trading to make sure nothing bad is happening with the crypto.

New! Comments
Have your say about what you just read! Leave me a comment in the box below.