Use the Over Sold Condition to Buy your Stocks
An over sold condition occurs when a stock price hits a low after a run down. It's a condition seen at the bottom of a naturally occurring wave of buying and selling that gives stock traders a good idea of when to buy into a stock position before the price goes back up.
I have great indicators that I use on my charts that tell me when a stock price has breached the over sold mark. These indicators are a great way to let me know when I should get into a trade as a stock price is soon to go back up. This condition occurs after a sell off to bring the price back down to a good value.
The Three Key Indicators of an Over Sold Condition of a Stock Price
There are three key over bought/over sold indicators that when used together, are a good signal of buys and sells. In particular, for this condition, they signal when the price is getting too low to maintain a downward trend (it is getting too cheap for people to not buy it).
Generally, when a stock price is getting too low, it will be in an under priced condition that investors begin seeing as a good deal. They believe the price will be gaining steam and will start going up, which most times will happen. It is not typical that the price will keep going down unless there is some major outside influence pushing it down further such as a poor sector, bear market, or a bunch of hype in the news and social media.
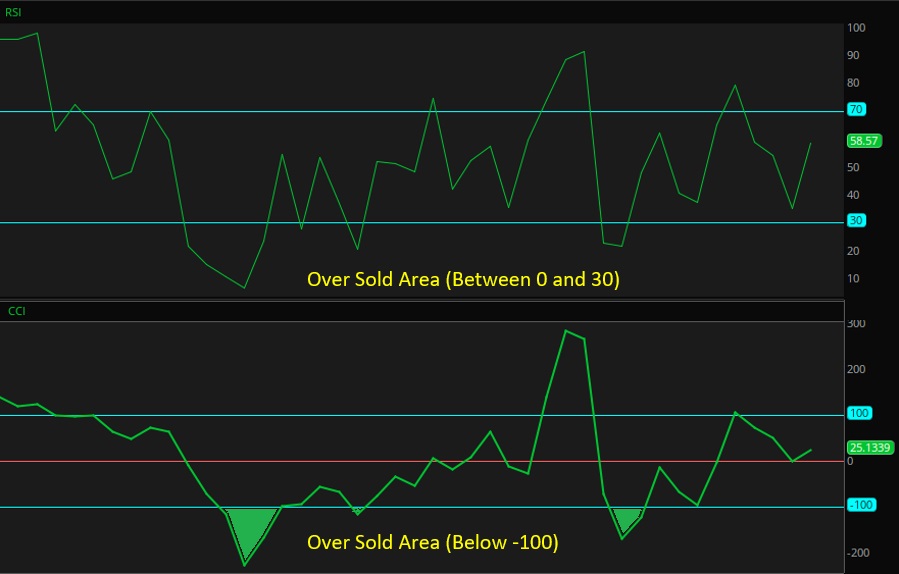
Indicator 1: The Relative Strength Index
The relative strength index (or RSI) is an oscillating indicator that calculates the speed and change of price movements of a stock. The RSI goes up and down between zero and 100.
Generally, an over sold condition exists once the indicator reads under 30. But a lot of stocks reach below 30 and become extremely oversold. This point (under 10) is usually a better time to buy. The lower the RSI, the more likely it is to jump up.
Indicator 2: The Commodity Channel Index
The commodity channel index (CCI) plots the current price over a given period of time relative to an average price level to measure the oscillating trend of the stock. It doesn't have a min or max level, but does go between a channel of 100 to -100.
Generally, an over sold condition exists when the CCI is under -100. Another great CCI indicator is to use the CCI Average indicator which shows two oscillating lines. When the CCI value crosses the average up while under -100, it is a signal that it is turning up.
Indicator 3: The Direction of Movement Indicator Stochastic Extreme
The direction of movement indicator (DMI) Stochastic Extreme is an over bought/over sold indicator, utilizing the DMI highs and lows. It follows along with CCI and RSI, and backs up the condition exists to buy a stock.
Generally, an over sold condition exists when the DMI value is below 10 in the indicator.
When the chart reaches multiple over sold signals, it is time to buy the security at the discounted price before the price starts heading back up. When the price does go up, it will eventually peak into an over bought condition.

New! Comments
Have your say about what you just read! Leave me a comment in the box below.