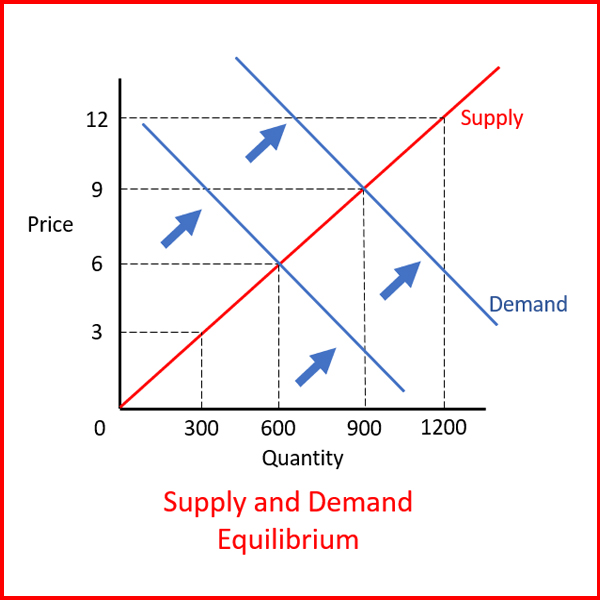
Supply and Demand Explained
Supply and demand of stock work just like supply and demand of anything else. If 10 wickets are created and 10 people buy those wickets, supply and demand are met and everything is great.
Of course, price of the wickets is going to start out high so the company makes the most money. But economics dictates and the price is driven down because not as many people are buying the wickets any more.
Eventually the price will be so low that everybody is trying to buy wickets but there is no more available or they are oversold. The price starts going back up to slow the buying down so supply can catch back up to the demand.
People continue buying the wickets, trying to get the best deal, but as they are buying, the price keeps getting higher. Eventually, the wickets will be overbought to a point where no one wants to buy any more because they are too expensive and the price begins to drop again.
This oscillating process happens over and over again (in a perfect world) so it can be easily predictable and stock market investors can set when to get in and out of a trade. But we all know that a perfect world will never exist. Many other things drive stock prices besides supply and demand, but we can be sure this process of price rising and falling will naturally occur all of the time.
Supply and Demand with Respect to Stocks
Stocks do the same exact thing, but instead of the standard terms, they are called stock support and resistance. When a stock reaches an "overbought" condition where price is very high, the demand starts to drop off and the price will fall back down. That's because the demand of the stock is "resisting" the price.
When a stock starts going to a low price again, demand goes up and investors start buying again. The investors who bought high sell so they don't lose money and eventually the supply of stocks that are selling start to run out (at least the ones willing to sell at this point). As supply drops, the stocks reach an "oversold" condition and the price starts going back up again, bouncing off of the "support" level of the price.
There are ways to estimate a support and resistance level that can provide a good feel for where the lows and highs will be. They are fairly accurate and can help you stay out of trouble during a trade. They help you establish sell limits so it will trigger to sell when it reaches the resistance or sell when it falls below the support.
As you can see, these elements are very important when it comes to how stock prices move. It produces an oscillation effect that assists several signalling indicators you can apply to your chart to help create decisions on when to buy and sell your stocks.
Just remember, every time you buy and sell, you are adding to the demand or supply depending on which way you trade.


New! Comments
Have your say about what you just read! Leave me a comment in the box below.