What is Stock Support and Resistance?
Stock support is the level at which a stock struggles to go any lower due to the limits of supply and demand of the stock. Stock resistance is the level at which a stock struggles to go any higher due to the limits of supply and demand of the stock.
Resistance and support are equally affected by supply and demand, changing as conditions in the world change. There is a point where they meet each other called equilibrium.
The goal in any supply and demand situation is to reach a point of equilibrium, which is where demand and supply meet or equal supply, equal demand.
How to Establish Stock Support and Resistance Levels
The goal of establishing a stock support and resistance level is to estimate the safe trading area of a stock, or the estimated high and low. There are many ways to determine stock support or stock resistance. However, I don't want to complicate things for you too much by throwing in too many of them. These easiest way to establish these levels is by establishing common highs and common lows over time.
Even if the stock is up and down, there are always points at which the stock tries, but it can't get any higher or lower.
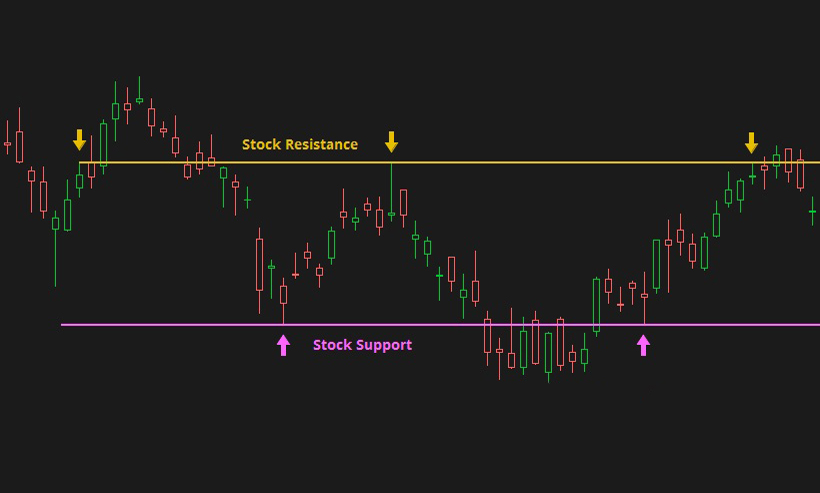
See the example below.
Common Highs and Lows
In the above example, support was chosen based on the 2 low points indicated with the pink up arrows. The support level extends out to infinity until a new support level is established.
Also in the above example, stock resistance was chosen based on the 3 high points indicated with yellow down arrows. The resistance level extends out just like the support level, until a new resistance is established.
These lines establish a safe trading area. Even though the price occasionally goes above and below those lines, setting limits between those lines would be a safer entry and exit than outside those lines.
There are occasions where the price will push through and run up or down from these levels. This is a break out and could indicate a trend shift and new support and resistance levels must be established.
This method is also known as channeling stocks.
Many stock market traders use stock support and resistance to establish buy and sell points or entry and exit points. If the stock price reaches these marks, it gives the investor a warm fuzzy that the price will continue to oscillate as normal.
If the price pushes above the resistance, then it may be a sign that the stock price will continue to gain momentum and rise further. If the price falls below the support level, it may be a sign that the stock price is losing momentum and the price may fall further.
Support and resistance are not too difficult to figure out, but when a stock price breaks out from these levels, you will have to reevaluate the new ones. In a flatter market, the levels won't change too often, but in an bear or bull market, these levels are difficult to track along with.


New! Comments
Have your say about what you just read! Leave me a comment in the box below.